Utilities
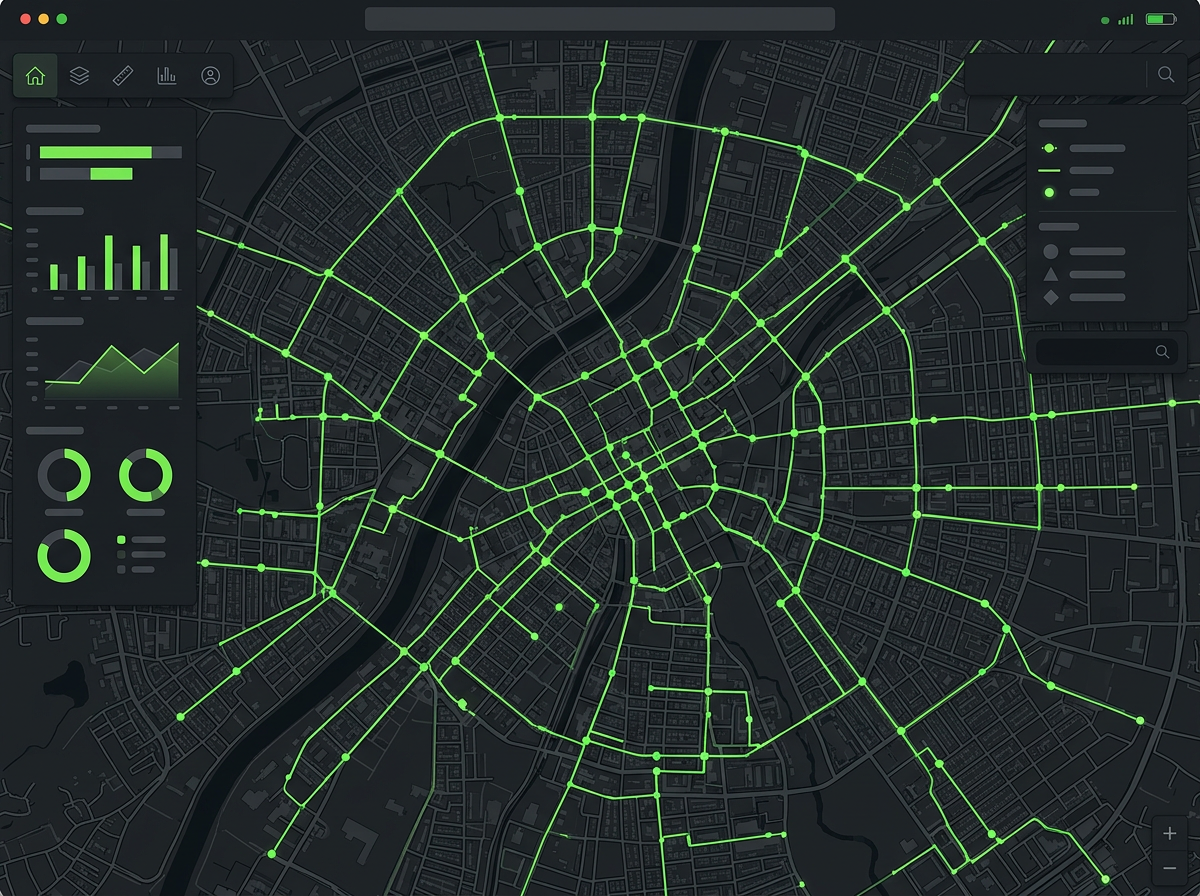
A live network map for a water utility
A browser-based asset viewer and outage planner that replaces a desktop-only workflow, so field and office staff work from the same live map.
- MapLibre
- PostGIS
- Vector tiles
Isoline is a GIS engineering studio. We design and ship web mapping apps, spatial data platforms and geospatial analytics for teams who make decisions on the ground.
01Services
One senior team across cartography, backend, frontend and data science — so nothing gets lost between the map and the database.
Fast, interactive map apps in the browser — vector tiles, custom styling, drawing and editing tools, and dashboards that stay smooth at millions of features.
Pipelines that ingest, clean and serve geodata at scale. We model PostGIS schemas, build ETL from raster and vector sources, and publish OGC-compliant services.
Turn location into insight: site selection, routing and network analysis, change detection from satellite imagery, and predictive models with spatial features.
Offline-first iOS and Android apps for inspections, surveys and asset capture, with GNSS integration and conflict-free sync back to your system of record.
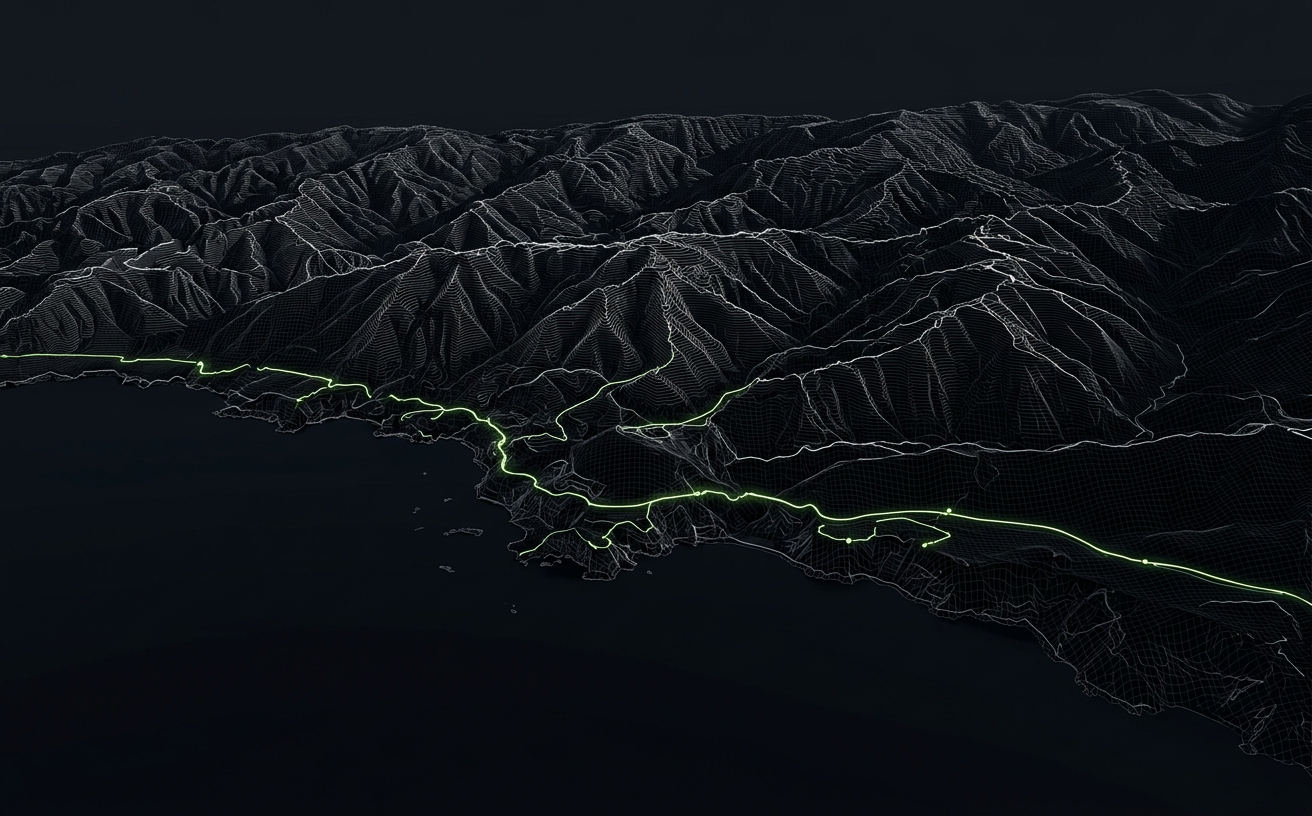
City-scale 3D scenes, terrain and point-cloud visualization, and BIM-GIS integration for planning, utilities and infrastructure operations.
Modernize legacy desktop GIS, move to the cloud, and connect spatial data to ERP, CRM and asset management platforms without disrupting operations.
02Example projects
Three examples of the kind of product we build. They are illustrative, not client case studies.
Utilities
A browser-based asset viewer and outage planner that replaces a desktop-only workflow, so field and office staff work from the same live map.
Agriculture
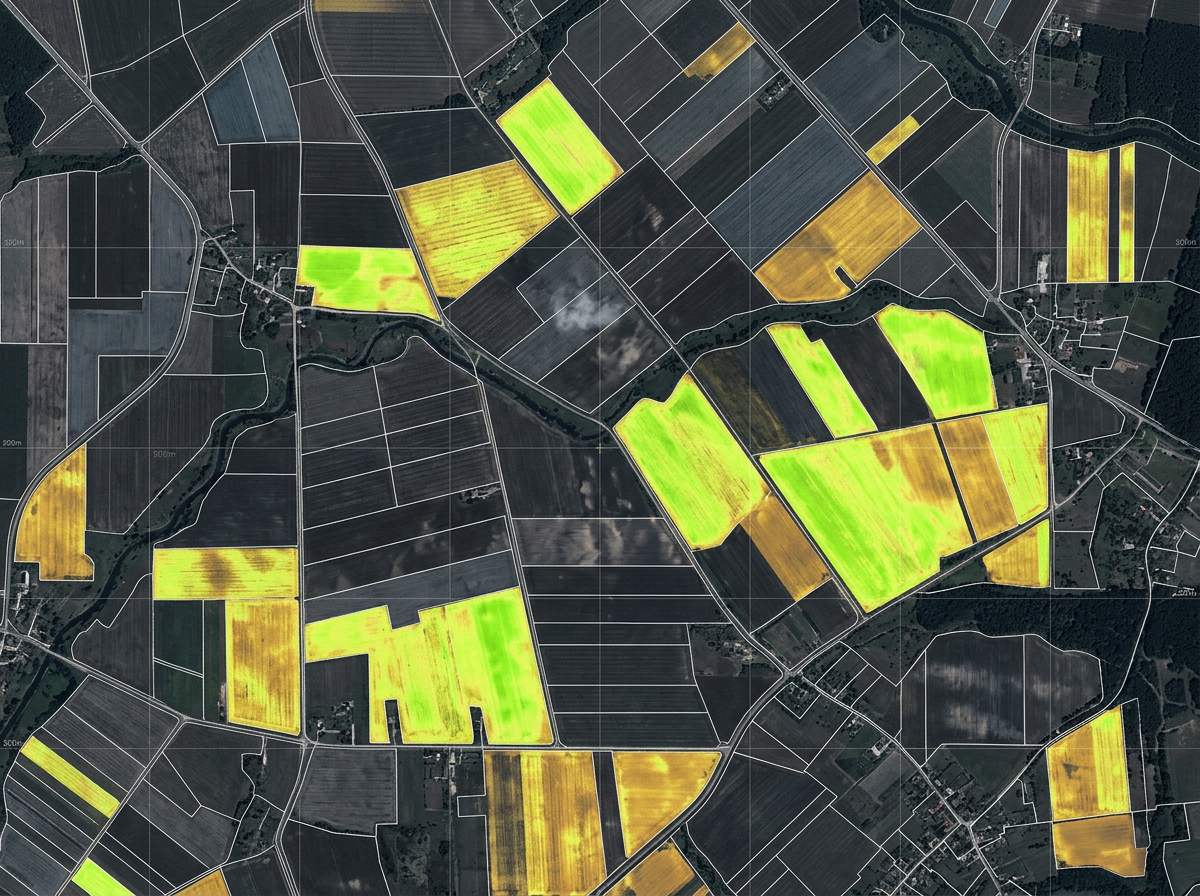
An imagery pipeline and analytics app that scores vegetation health for every parcel, every five days.
Urban planning
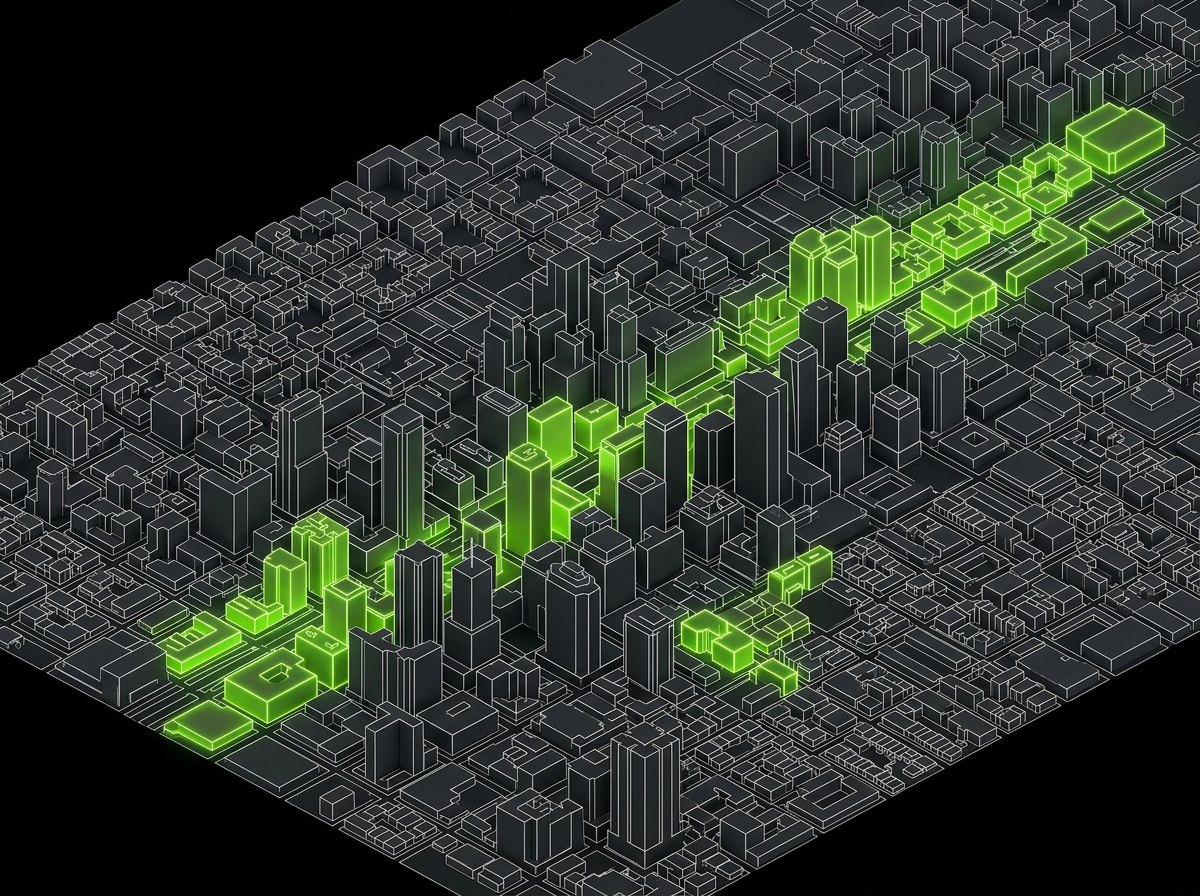
LiDAR, building footprints and zoning data combined into a browser 3D model that planners use to evaluate proposals.
03Process
We audit your data, workflows and users, then define the spatial questions the product must answer.
A clickable map prototype on your real data, so stakeholders can test ideas before we commit to architecture.
Two-week sprints with working releases, automated tests for geometry and projections, and weekly demos.
Performance tuning, monitoring and a dedicated team that keeps your platform evolving with your data.
04Stack
We pick tools for your data and team — open source where it wins, commercial platforms where you already have them.
05Contact